Daily Wonder
Market Pulse
Tuesday, 27 October 2026 · Indian & Global Markets
28 Oct 2026 · 5 min read
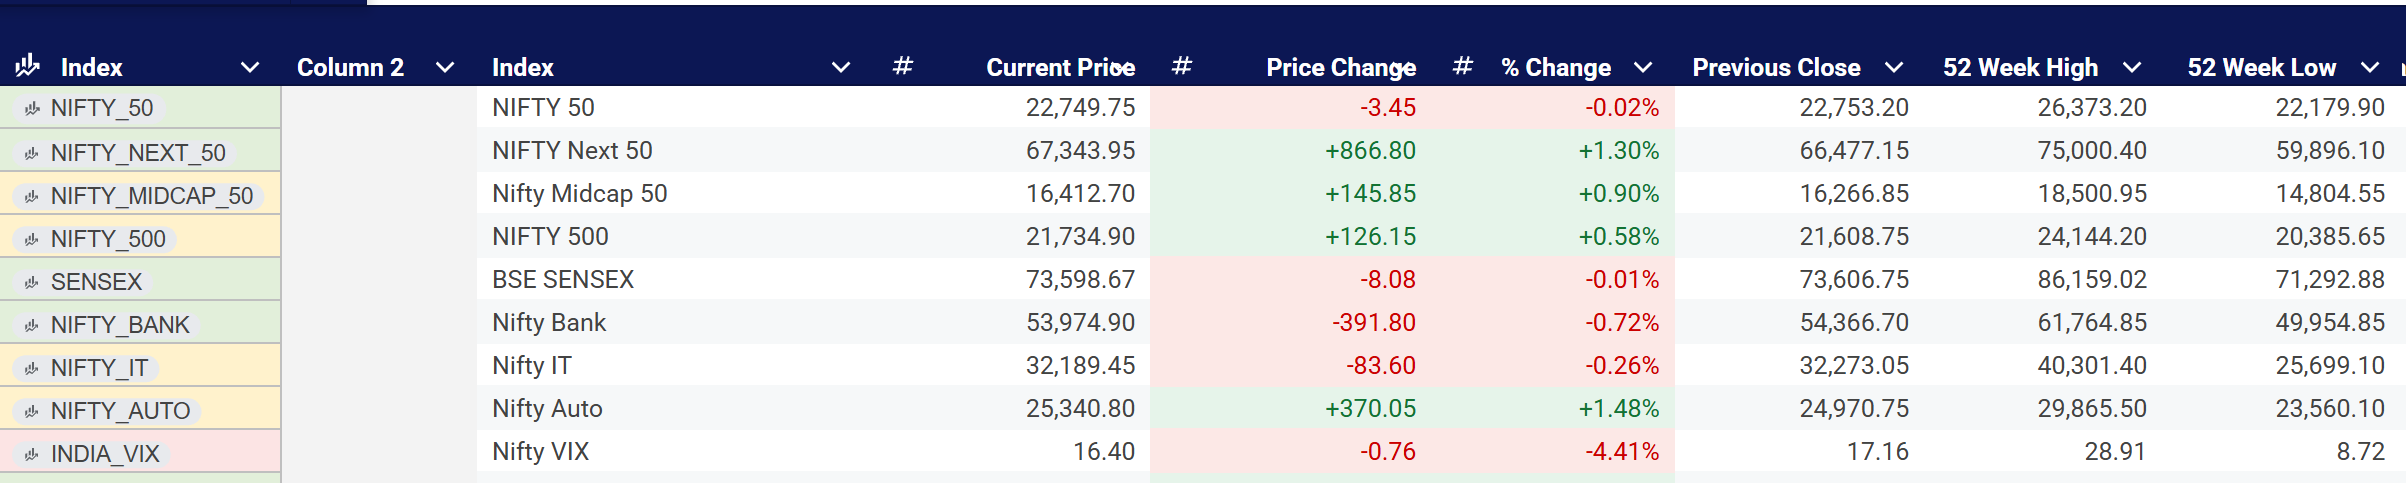
A Flat Nifty, a Stronger Broader Market
First, what do these indices tell us?
NIFTY 50: Tracks 50 large, liquid Indian companies across sectors. Because it is weighted by free-float market capitalisation, the largest constituents have a disproportionate influence on its movement.
NIFTY Midcap 100: Tracks 100 mid-sized companies, offering a view of market performance beyond the largest stocks.
NIFTY Smallcap 100: Tracks 100 smaller listed companies. These stocks can be more sensitive to liquidity, domestic risk appetite and valuation changes.
The divergence matters. While the NIFTY 50 struggled to find direction, mid-caps gained 1% and small-caps advanced 2.69%. Buying interest extended beyond large-cap stocks, even as weakness in heavyweight constituents limited the benchmark's upside.
Monthly derivatives expiry added to intraday volatility, while investors remained cautious ahead of the US Federal Reserve's policy decision on 28 October.
- Realty and Pharma Lead: Realty gained 1.94% and pharma rose 1.91%, while auto stocks also attracted buying. Strength in these sectors helped offset weakness among large private banks and IT stocks.Mankind Pharma was among the stocks attracting buying after reporting strong quarterly results.
- Banking : Heavyweights Weigh on the Index: ICICI Bank, Axis Bank and HDFC Bank faced selling pressure. Given the substantial weight of large financial companies in the NIFTY 50, weakness in these stocks can offset advances across multiple smaller sectors.
- IT : Forward Guidance Matters More Than the Headline: The sector remained under pressure amid concerns around growth expectations and the outlook for traditional technology services. A company can report higher revenue yet underperform if its forward guidance falls short of market expectations. AI adds a longer-term question: can Indian IT companies convert AI demand into incremental revenue.
BRENT CRUDE OIL
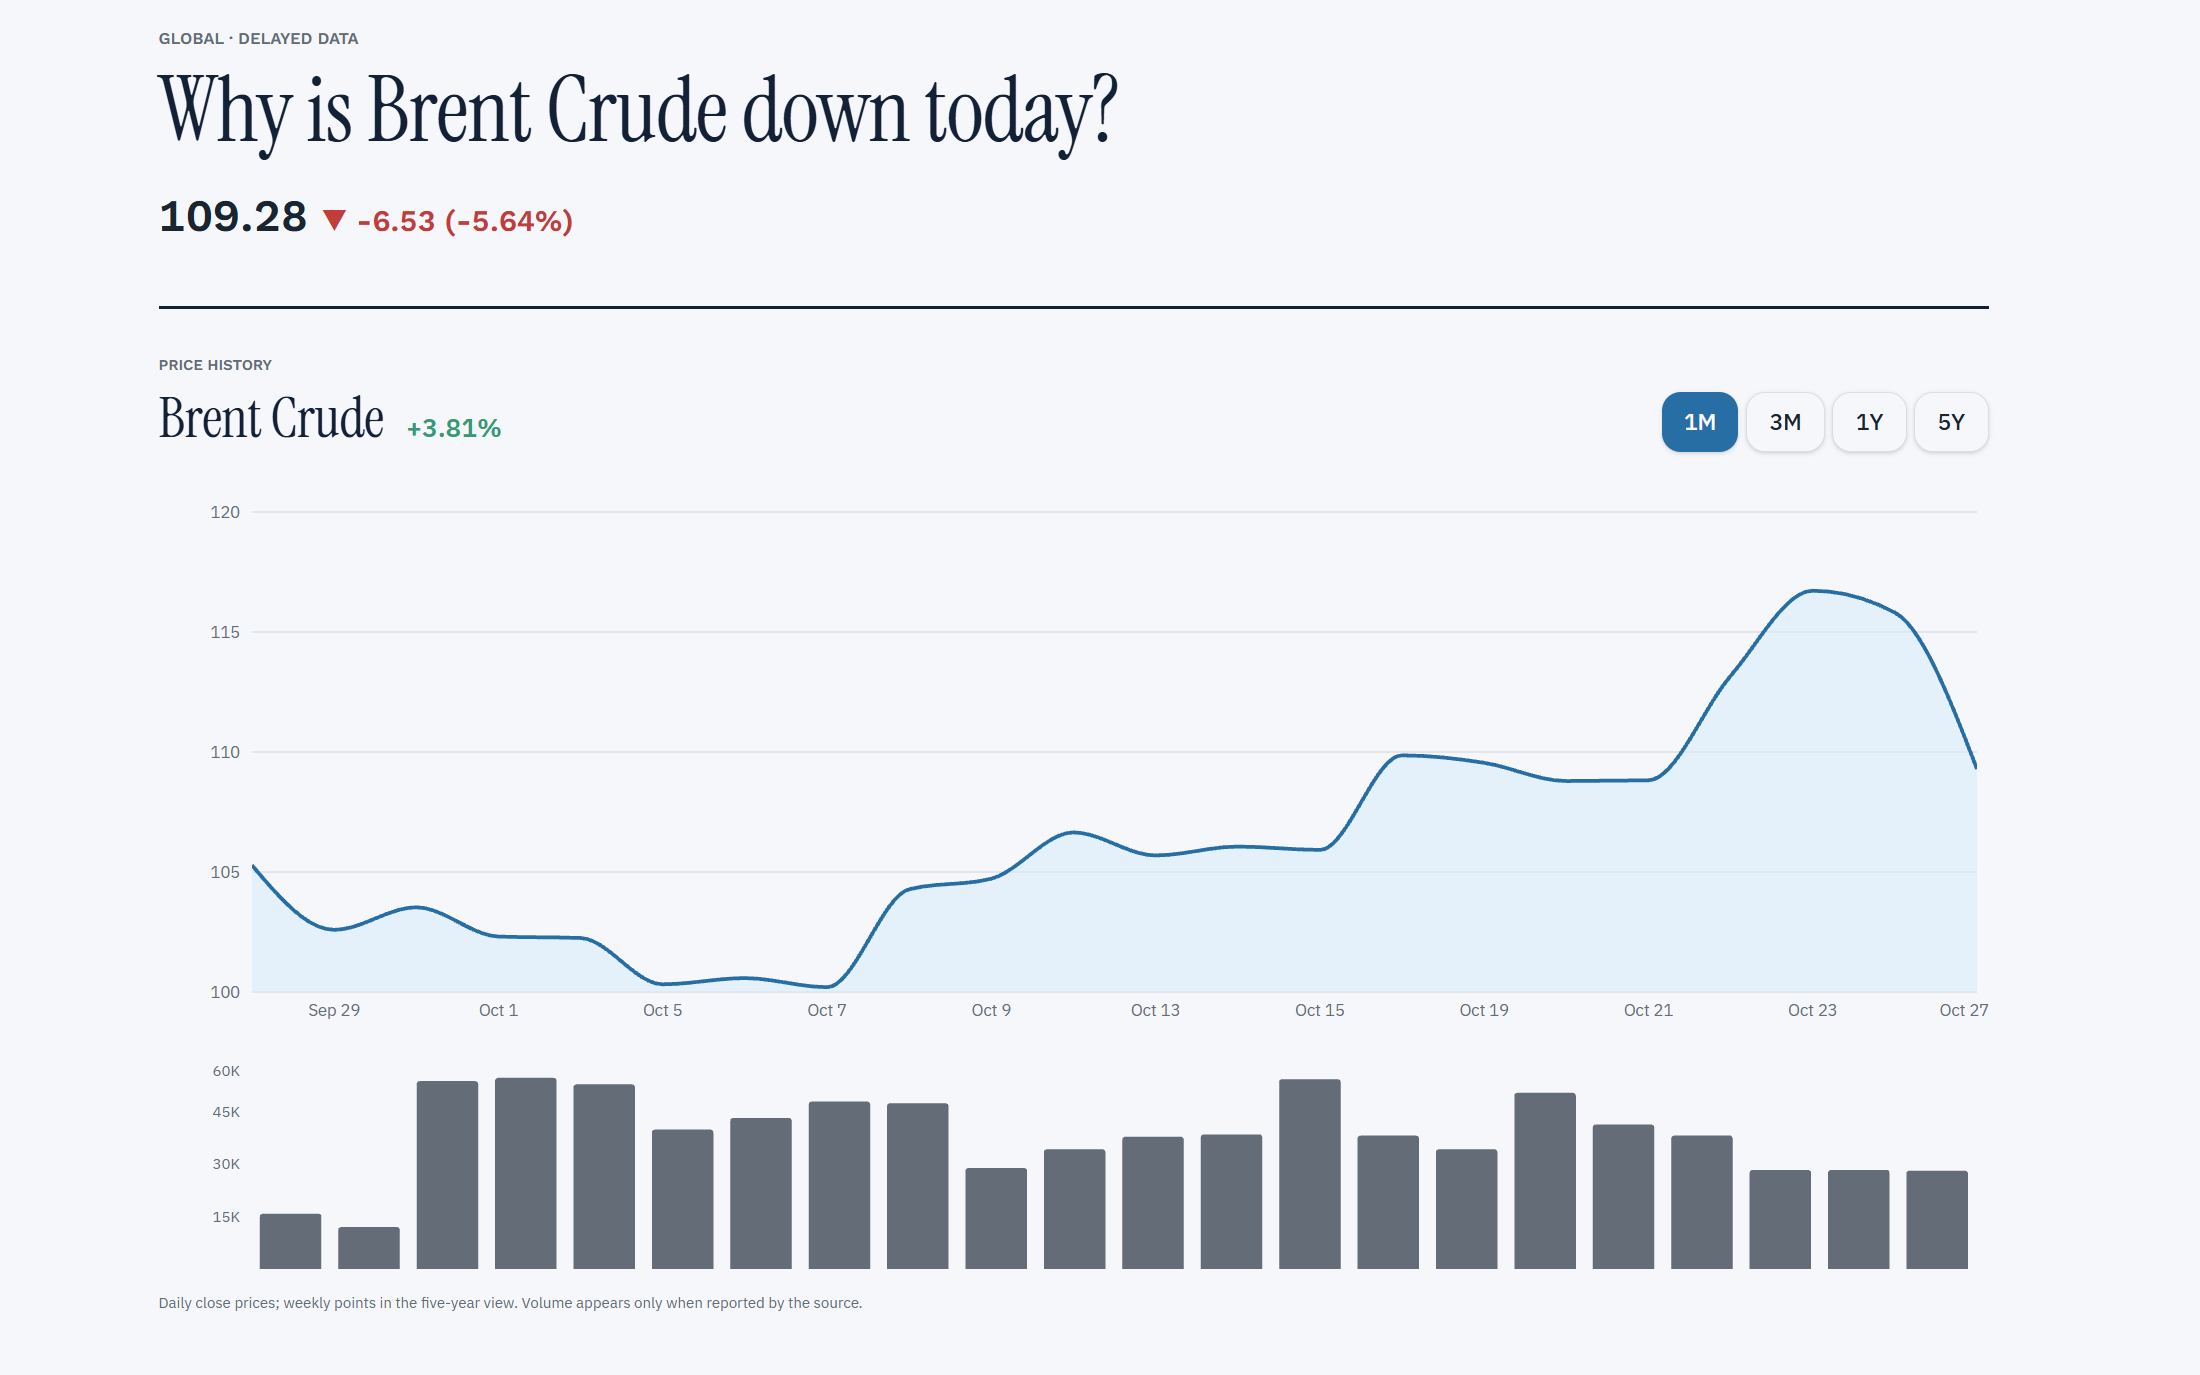
North Sea, offshore UK and Norway
Global pricing benchmark used widely for seaborne crude, including oil relevant to European and Asian markets.
- Brent crude fell on 27 October primarily because diplomatic efforts raised hopes of easing the US–Israeli conflict with Iran, reducing some of the geopolitical risk premium priced into oil but as we know it has been up since today morning.
source: US Energy
GLOBAL MARKETS

The Nasdaq gained 1.18%, outperforming the S&P 500's 0.60% advance, as renewed enthusiasm around AI infrastructure lifted semiconductor stocks. Anthropic's IPO filing and the reported $63 billion financing arrangement linked to Broadcom technology purchases reinforced expectations of continued AI infrastructure spending. Broadcom rose around 4%, while the semiconductor index advanced 3.6%.
Russell 2000 - Small-Caps Join the Rally: The index gained 1.16% as easing crude prices and a stabilisation in Treasury yields supported sentiment. Lower energy costs can relieve inflation concerns, while more stable yields can help borrowing-sensitive businesses
South Korea — Semiconductor Strength: The KOSPI rose sharply as Samsung Electronics and SK Hynix benefited from the global AI-chip rally and stronger-than-expected Korean economic growth. The focus remains on high-bandwidth memory demand and whether semiconductor earnings can sustain the market's expectations
FII/DII
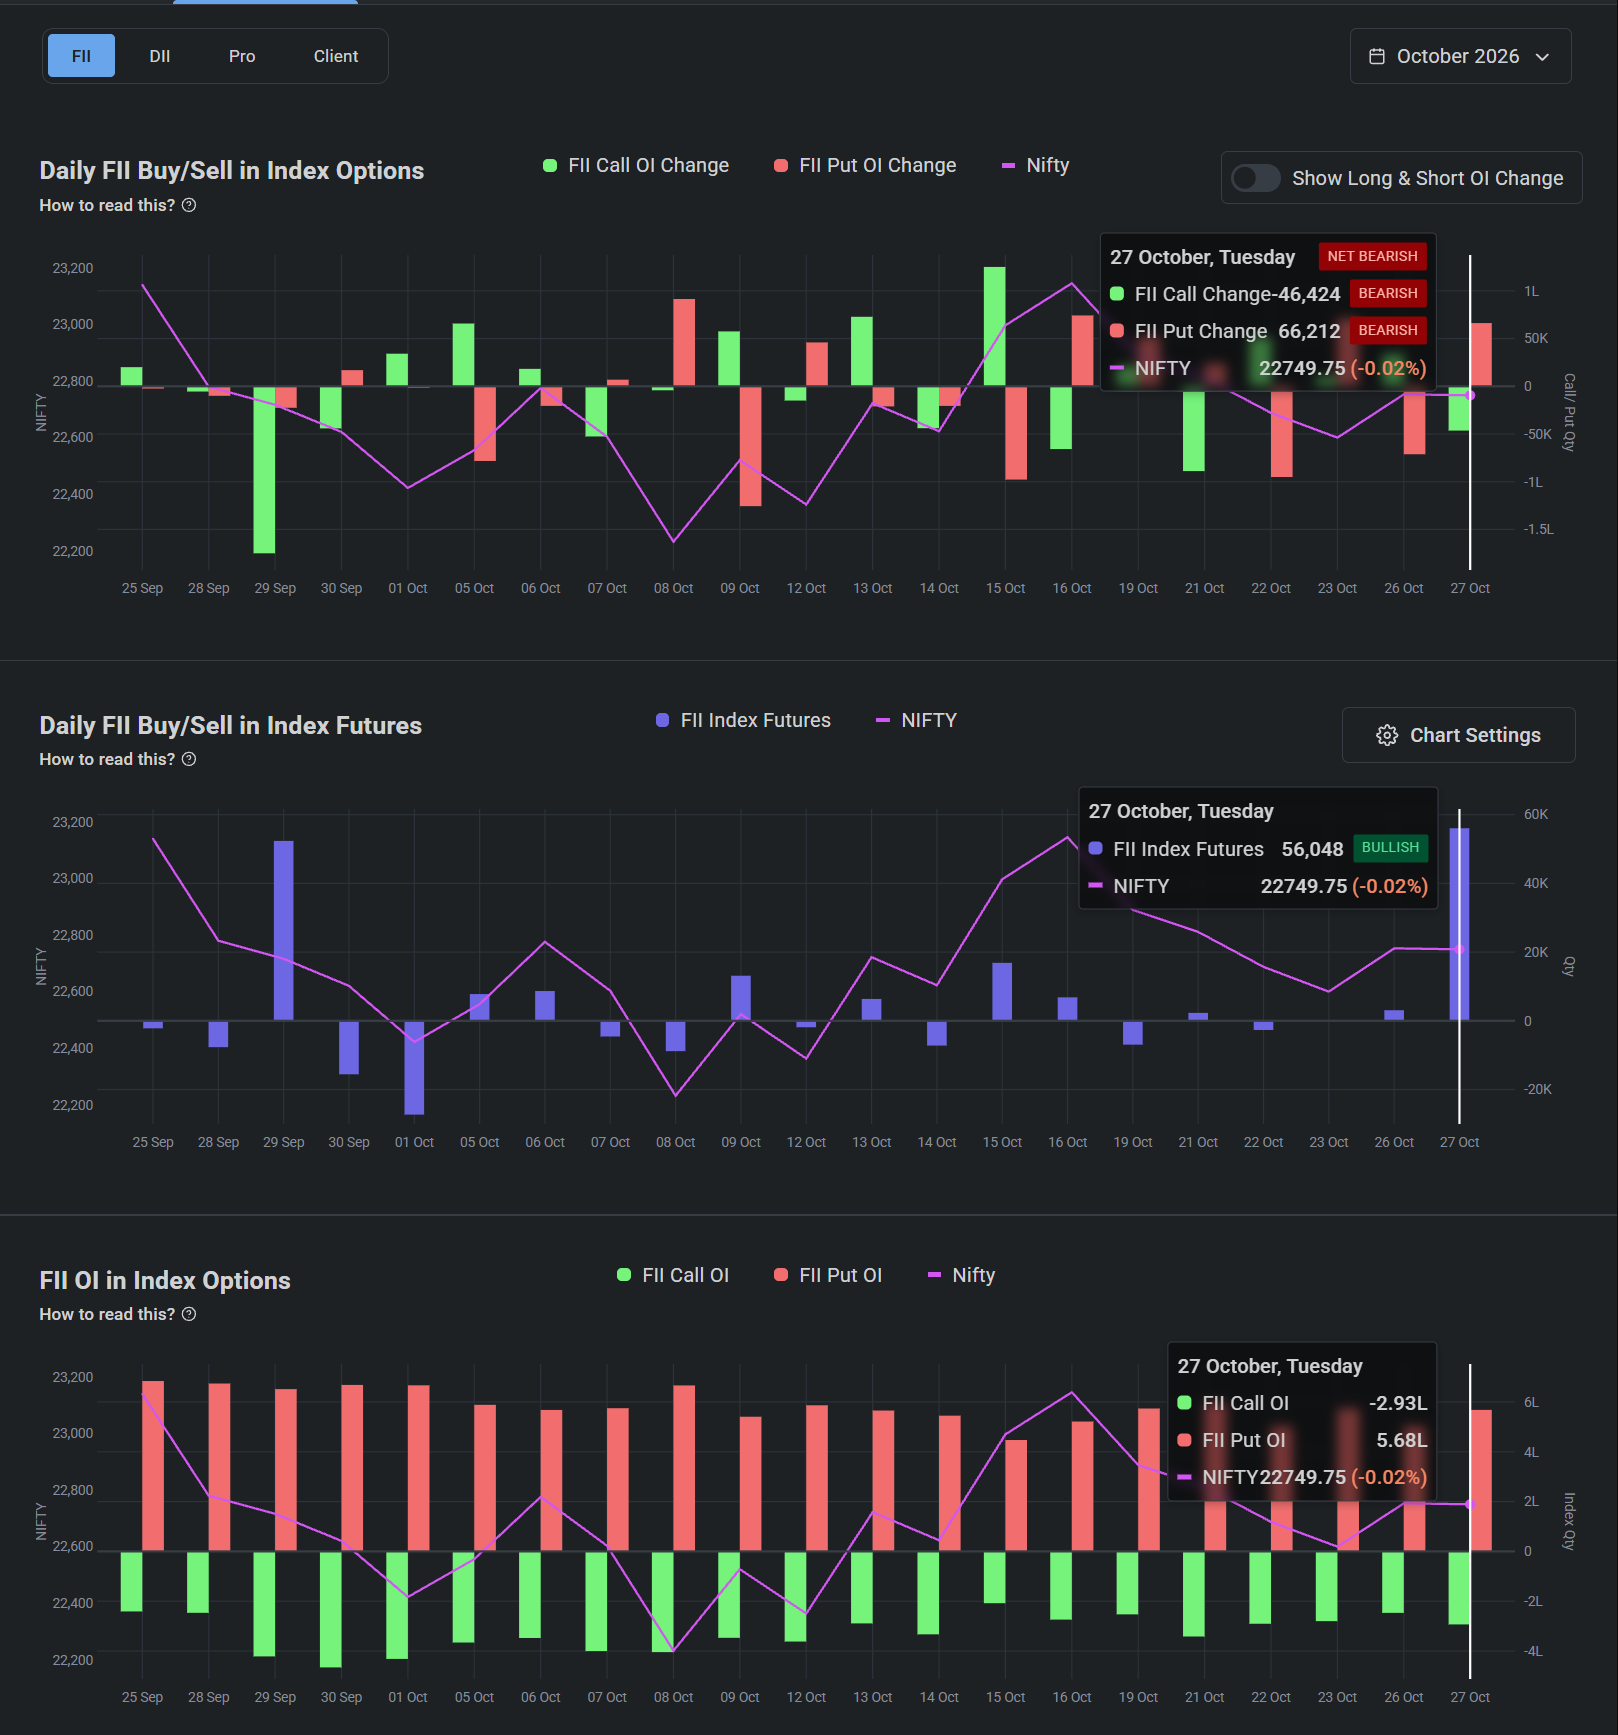
source: sensibull
FIIs were net buyers in the cash market, but their index-futures position remained net short. The daily reduction in that short position suggests some easing of bearish exposure, though it does not establish a bullish reversal. Cash purchases and derivatives positions can reflect different strategies, hedges and time horizons.
FED WATCH TOOL
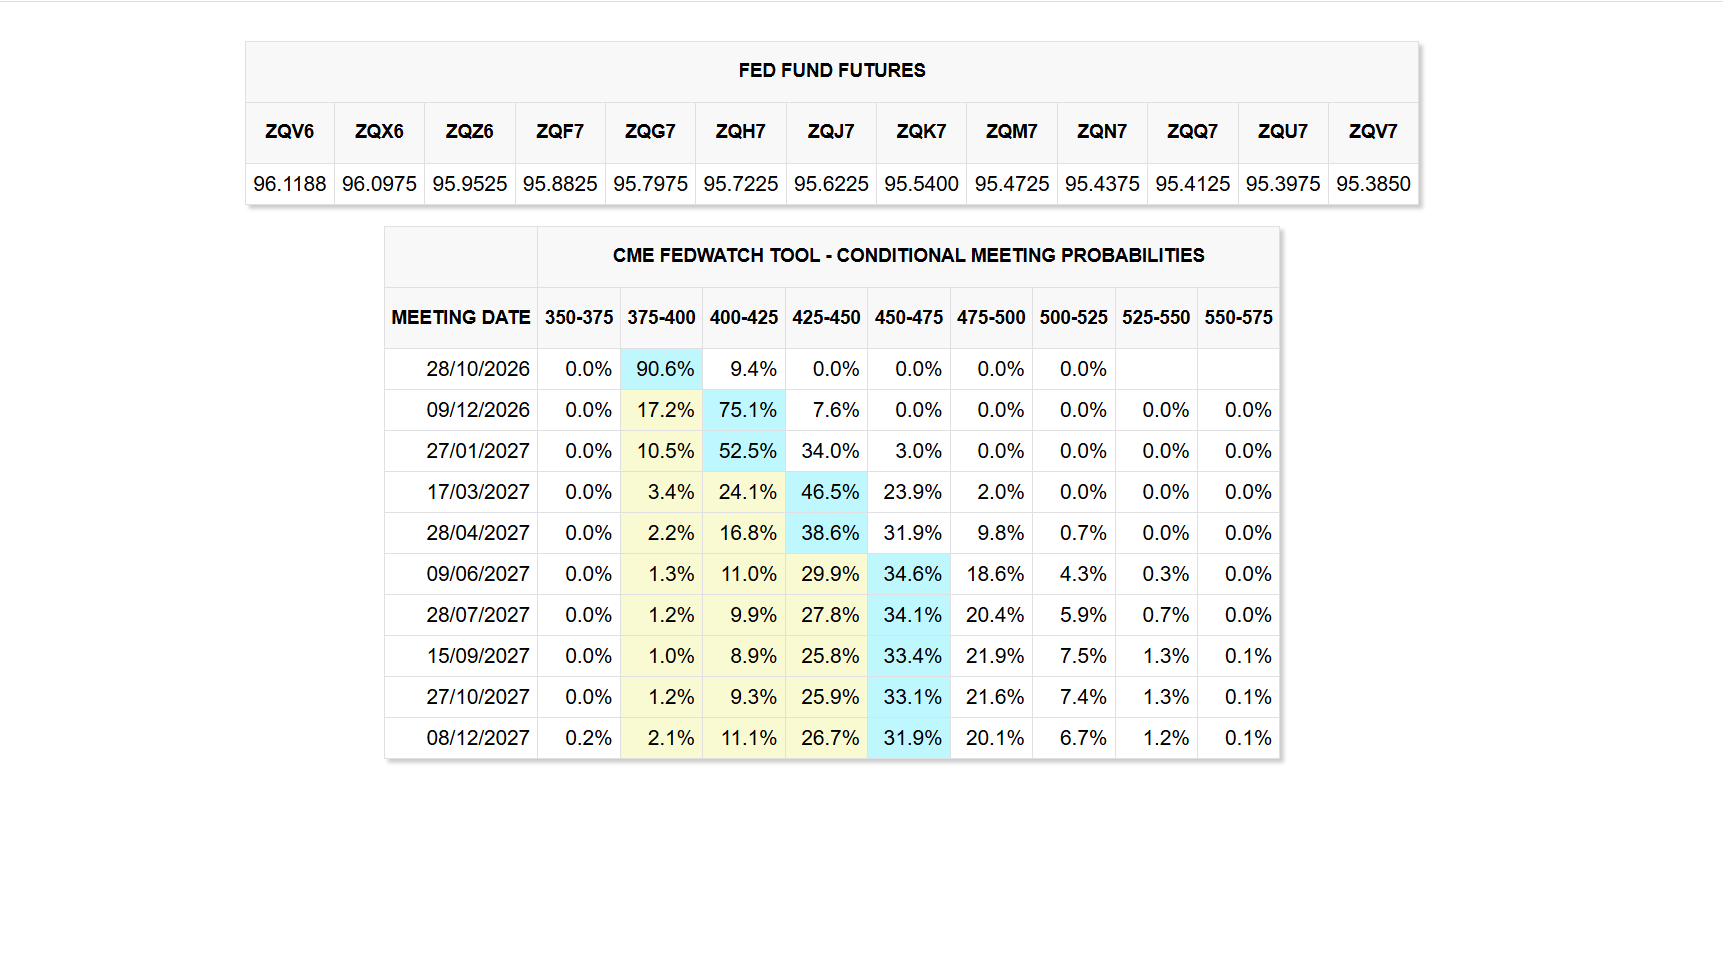
source: Fed Watch Tool (FedWatch probabilities reflect futures-market pricing, not a guarantee of the policy outcome or a direct measure of the Fed's own intentions.)
The FedWatch Tool indicated that markets overwhelmingly expected the Federal Reserve to hold rates at 3.75%–4.00%, with only a 9.4% probability assigned to a 25-basis-point hike.
MACRO CALENDAR
Trading Economics calendar · 28–30 October 2026 · Times in IST
The week is dominated by central-bank decisions, US inflation and growth data, and India's industrial production figures. These events matter because they can shift expectations for interest rates, bond yields, currencies and equity valuations.
Wednesday, 28 October
High impact
4:00 PM | India Industrial Production (IIP) Measures industrial output; helps assess domestic manufacturing momentum. |
7:15 PM | Bank of Canada decision A signal on global monetary policy and growth expectations. |
8:00 PM | US EIA crude oil inventories Inventory changes can move oil prices and influence inflation expectations. |
11:30 PM | US Federal Reserve rate decision The week's primary macro catalyst; focus on the statement and forward guidance. |
Calendar:
Thursday, 29 October
High impact
6:00 PM | US Q3 GDP — Advance estimate The first estimate of quarterly growth; a key test of economic resilience. |
6:00 PM | US PCE inflation and Core PCE The Fed's preferred inflation measures; stronger readings could reinforce a restrictive policy outlook. |
6:00 PM | US personal income and spending Helps assess consumer demand and the sustainability of US growth. |
6:45 PM | European Central Bank decision Watch the policy statement and guidance on inflation and growth. |
Calendar:
Friday, 30 October
Medium–high impact
8:30 AM | Bank of Japan decision Potential implications for the yen, global bond yields and carry-trade positioning. |
3:30 PM | Eurozone Q3 GDP An assessment of regional growth momentum. |
4:00 PM | India fiscal deficit / government accounts Helps track fiscal execution and government borrowing requirements. |
6:00 PM | US Employment Cost Index Tracks labour-cost pressures and their implications for services inflation. |